IND vs AUS 2nd ODI DLS Par Score: As expected the rain intervened in the IND vs AUS 2nd ODI game at Holkar Cricket Stadium, Indore and halted the game when Australia scored 56 runs for 2-wicket loss in their 400-run target.
2023 IND vs AUS 2nd ODI DLS Par Score
As of every other rain-intervened game, fans start to hunt for the DLS target if rain is prolonged beyond the limit.
The cut-off for play to start is 21:28 IST for a 20-over game. The 20-over target for Australia is 230, so Australia will need 174 in 11 overs. Hopefully, it will start earlier. We started losing overs at 19:27.
Targets for Australia according to DLS method
- 354 in 40 overs
- 328 in 35 overs
As per a report, the match will lose one over every 4 minutes from 19:27 IST.
As fas as the game is concerned, Australia won the toss and opted to field first. Though India lost their opening batter Ruturaj Gaikwad for cheap, Gill and Iyer scored a TON each and scored a 200 runs partnership and led India to score beyond 200 runs.
Abbott broke the partnership by dismissing Iyer for 105 runs while Green dismissed Gill for 104 runs. With KL Rahul’s 52 and Suryakumar Yadav’s unbeaten 72, India scored 399 runs for 5 wickets loss at the end of 50 overs.
On the other hand, Australia made a struggled start where they lost 2 wickets before crossing 10 runs. Prasidh who was named as the replacement player for Bumrah dismissed Matthew Short and Steve Smith for 9 and 0 respectively.
Following Steve Smith’s dismissal, David Warner and Marnus Labuschagne made a 47-run partnership before rain stopped the game.
How DLS is Calculated?
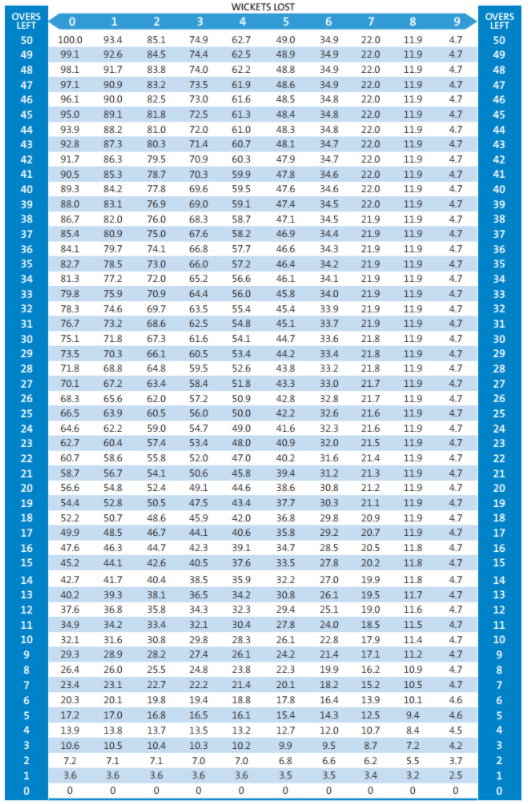
To calculate a target, the formula may simply be expressed as:
Team 2’s par score = Team 1’s score x (Team 2’s resources/Team 1’s resources).
During the match after the interruption, there are only two factors remain with the team for the calculation of this method.
Every team available with these two resources namely:
- Remaining Overs
- Remaining Wickets
On the basis of these two resources, Frank Duckworth and Tony Lewis have prepared a chart which suggests that how many resources are left with the batting side in different situations.

Real-time Example of a DLS Method Calculation:
Let us take an example that happens earlier before in DLS history where India beats Australia by 26 runs. This happens in the first ODI of Australia tour of India in Septem
- In the 1st innings, India scored 7/281 in 50 overs.
- During the innings break, rain interrupts play, and the match is reduced to 21 overs.
- The 2nd innings commences, with Australia requiring 164 for victory.
- Australia finishes their innings on 9/137 off 21 overs.
- India wins by 26 runs on the D/L Method.
WATCH: How DLS Method is Calculated in Cricket By ICC

