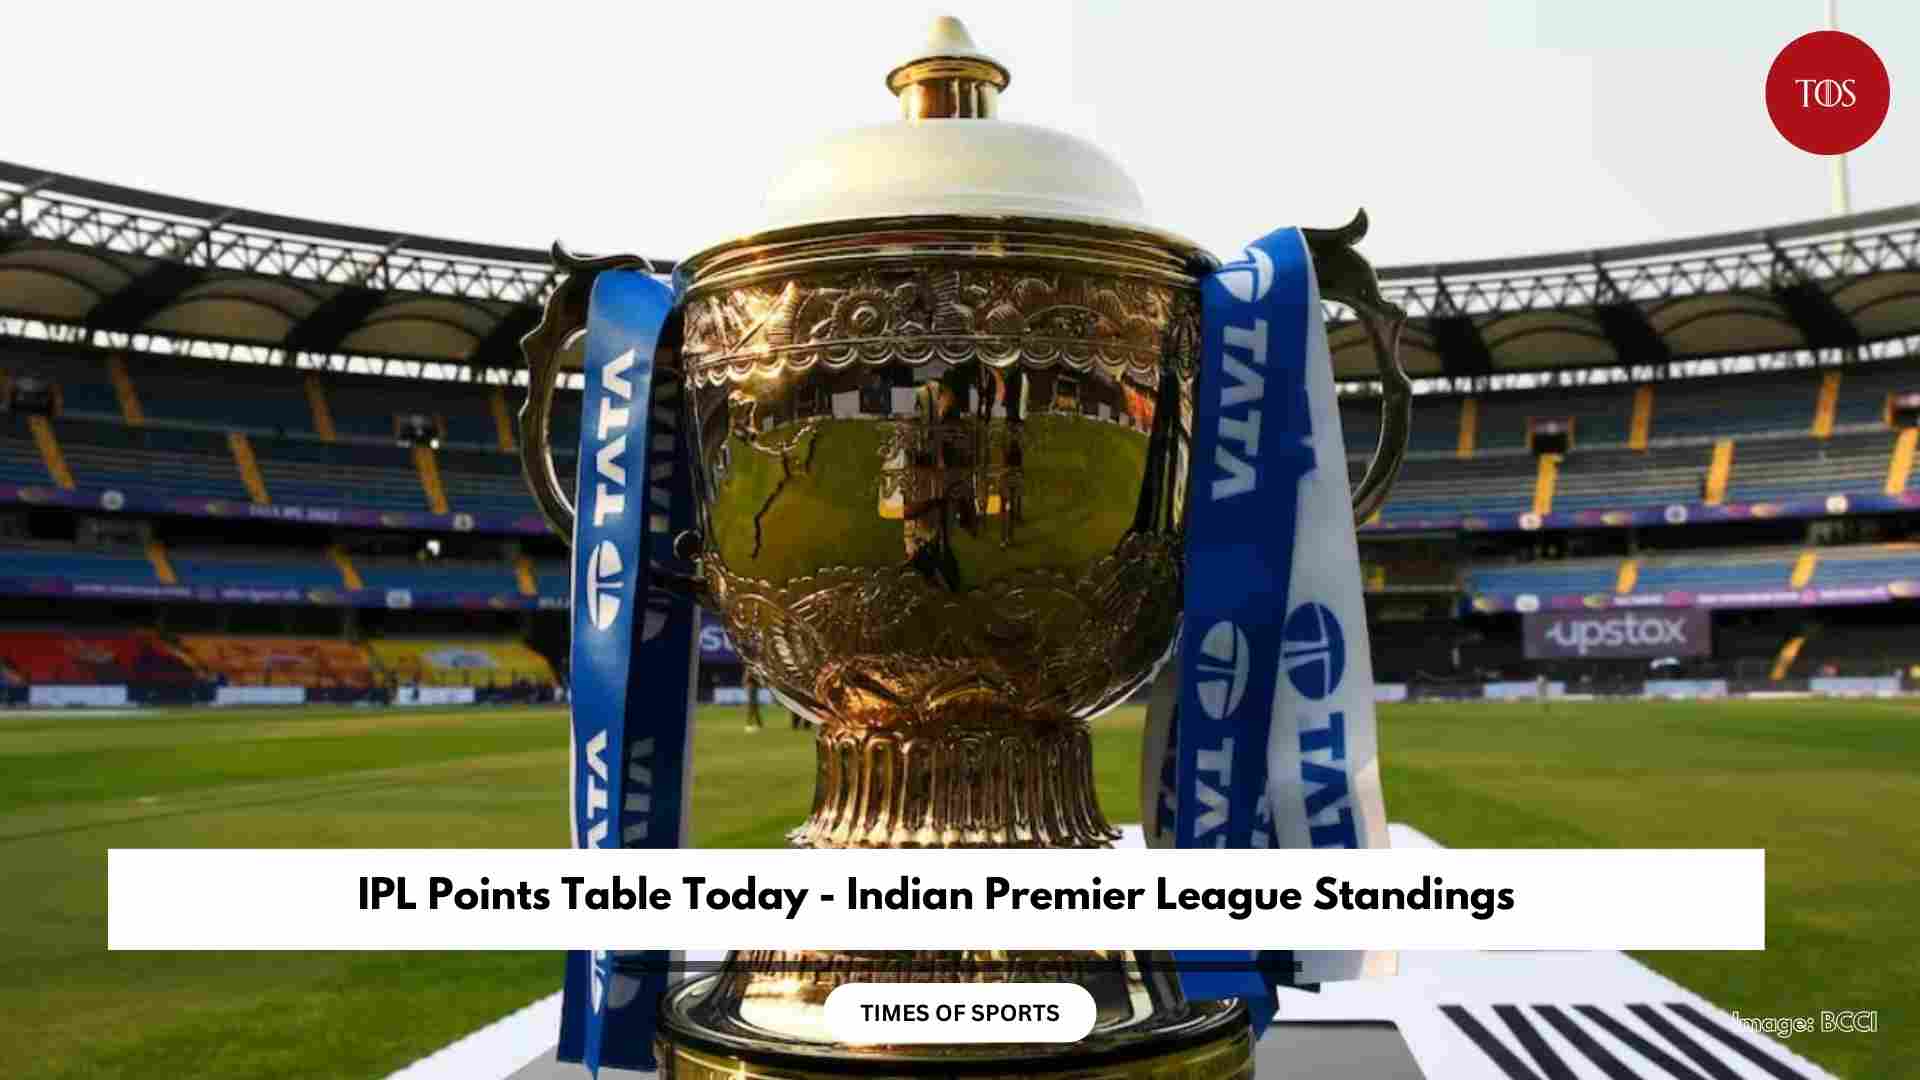
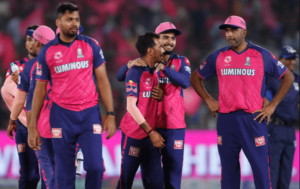
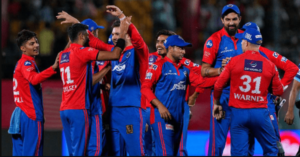
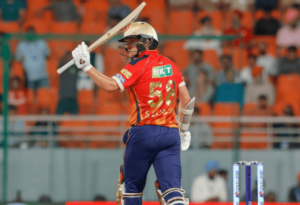
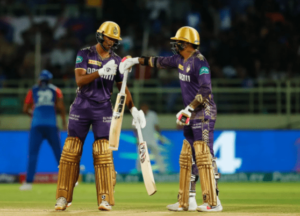
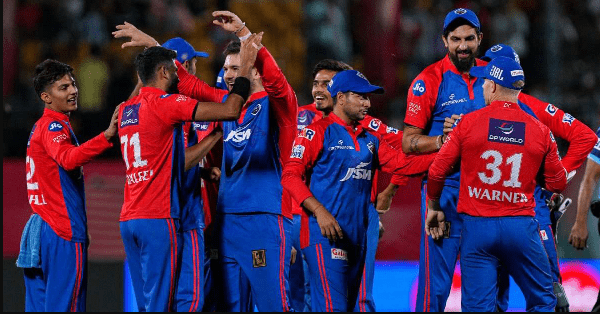
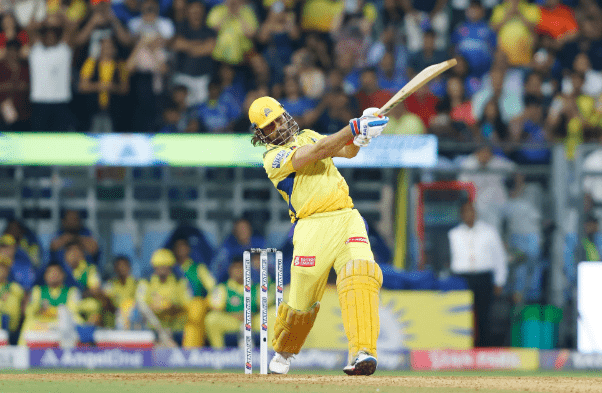
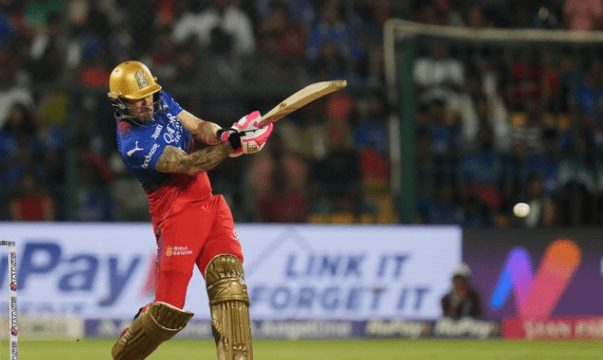
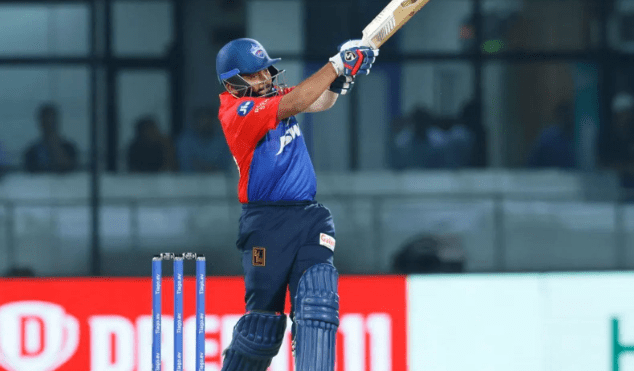
Times of Sports (TOS) listed the IPL points table along with winners and runners’ details since 2008. The Indian Premier League is considered one of the richest and most famous domestic leagues in the cricket world.
Indian Premier League has been played since 2008. Every year based on the points table, the top four teams would enter the playoff matches.
As per IPL 2024 Schedule, each team will clash with one another in one home and one away match each for the coveted trophy.
All 10 sides will compete against each other in the league phase. Every side will play seven games at home and away during the league and will play a total of 14 matches. The top four teams at the end of the league phase will qualify for the playoffs.
IPL Points Table 2024 Rules
During the league stage, two points are awarded to a side for a win and one in case of a washout.
- For a Win, the winning team gets 2 points
- In case of match is abandoned or ends abruptly or No Result, each team will be awarded 1 point.
- In case of loss, the defeated team get 0 points
In the case of a tie, in the IPL score table, the following points will be taken into consideration.
- Team with a higher number of points.
- If points are equal, the higher number of team wins will be considered
- If still, the points are equal, the net run rate is seen
- If still there is a tie, the team with the lower bowling strike rate will be considered
- If still there is equality, it results in a head-to-head meeting.
IPL Points Table 2024
IPL points table 2024 Today will be updated once the match(s) are completed. At the end of each league match the points table will update with the NRR. The Points table rules are explained below the points table:
| Teams | Mat | Won | Lost | Tied | NR | Pts | NRR |
| Rajasthan Royals | 8 | 7 | 1 | 0 | 0 | 14 | +0.698 |
| Kolkata Knight Riders | 8 | 5 | 3 | 0 | 0 | 10 | +0.972 |
| Sunrisers Hyderabad | 8 | 5 | 3 | 0 | 0 | 10 | +0.577 |
| Lucknow Super Giants | 8 | 5 | 3 | 0 | 0 | 10 | 0.148 |
| Delhi Capitals | 10 | 5 | 5 | 0 | 0 | 10 | -0.276 |
| Chennai Super Kings | 8 | 4 | 4 | 0 | 0 | 8 | +0.415 |
| Gujarat Titans | 9 | 4 | 5 | 0 | 0 | 8 | -0.974 |
| Punjab Kings | 9 | 3 | 6 | 0 | 0 | 6 | -0.187 |
| Mumbai Indians | 9 | 3 | 6 | 0 | 0 | 6 | -0.261 |
| Royal Challengers Bengaluru | 9 | 2 | 7 | 0 | 0 | 4 | -0.721 |
IPL Points Table Since 2008
IPL Points table history since 2008, as you see the latest points table above, you can see the remaining set of points table and how team fared below.
IPL Points Table 2023
Check out the IPL Points Table 2023 below with NRR and team standings below:
| Teams | Mat | Won | Lost | Tied | NR | Pts | NRR |
| Gujarat Titans (Q) | 14 | 10 | 4 | 0 | 0 | 20 | +0.809 |
| Chennai Super Kings (Q) | 14 | 8 | 5 | 0 | 1 | 17 | +0.652 |
| Lucknow Super Giants (Q) | 14 | 8 | 5 | 0 | 1 | 17 | +0.284 |
| Mumbai Indians (Q) | 14 | 8 | 6 | 0 | 0 | 16 | -0.044 |
| Rajasthan Royals (E) | 14 | 7 | 7 | 0 | 0 | 14 | +0.148 |
| Royal Challengers Bangalore (E) | 14 | 7 | 7 | 0 | 0 | 14 | +0.135 |
| Kolkata Knight Riders (E) | 14 | 6 | 8 | 0 | 0 | 12 | -0.239 |
| Punjab Kings (E) | 14 | 6 | 8 | 0 | 0 | 12 | -0.304 |
| Delhi Capitals (E) | 14 | 5 | 9 | 0 | 0 | 10 | -0.808 |
| Sunrisers Hyderabad (E) | 14 | 4 | 10 | 0 | 0 | 8 | -0.590 |
IPL Points Table 2022
As per IPL grouping system, MI, KKR, RR, DC and LSG are placed under Group A. Check out the IPL 2022 Group A Points Table below:
| Teams | Mat | Won | Lost | Tied | NR | Pts | NRR |
| Gujarat Titans (Q) | 14 | 10 | 4 | 0 | 0 | 20 | +0.316 |
| Rajasthan Royals (Q) | 14 | 9 | 5 | 0 | 0 | 18 | +0.298 |
| Lucknow Super Giants (Q) | 14 | 9 | 5 | 0 | 0 | 18 | +0.251 |
| Royal Challengers Bangalore(Q) | 14 | 8 | 6 | 0 | 0 | 16 | -0.253 |
| Delhi Capitals(E) | 14 | 7 | 7 | 0 | 0 | 14 | +0.204 |
| Punjab Kings(E) | 14 | 7 | 8 | 0 | 0 | 14 | +0.126 |
| Kolkata Knight Riders (E) | 14 | 6 | 8 | 0 | 0 | 12 | +0.146 |
| Sunrisers Hyderabad (E) | 14 | 6 | 8 | 0 | 0 | 12 | -0.379 |
| Chennai Super Kings (E) | 14 | 4 | 10 | 0 | 0 | 8 | -0.203 |
| Mumbai Indians (E) | 14 | 4 | 10 | 0 | 0 | 8 | -0.506 |
IPL Points Table 2021
| Teams | Mat | Won | Lost | Tied | NR | Pts | NRR |
| Delhi Capitals | 14 | 10 | 4 | 0 | 0 | 20 | +0.481 |
| Chennai Super Kings(C) | 14 | 9 | 5 | 0 | 0 | 18 | +0.455 |
| Royal Challengers Bangalore | 14 | 9 | 5 | 0 | 0 | 18 | -0.140 |
| Kolkata Knight Riders(R) | 14 | 7 | 7 | 0 | 0 | 14 | +0.587 |
| Mumbai Indians | 14 | 7 | 7 | 0 | 0 | 14 | +0.116 |
| Punjab Kings | 14 | 6 | 8 | 0 | 0 | 12 | -0.001 |
| Rajasthan Royals | 14 | 5 | 9 | 0 | 0 | 10 | -0.993 |
| Sunrisers Hyderabad | 14 | 3 | 11 | 0 | 0 | 6 | -0.545 |
IPL Points Table 2020
| Teams | Mat | Won | Lost | NR | Pts | NRR |
| Mumbai Indians(C) | 14 | 9 | 5 | 0 | 18 | +1.107 |
| Delhi Capitals(R) | 14 | 8 | 6 | 0 | 16 | -0.109 |
| Sunrisers Hyderabad | 14 | 7 | 7 | 0 | 14 | +0.608 |
| Royal Challengers Bangalore | 14 | 7 | 7 | 0 | 14 | -0.172 |
| Kolkata Knight Riders | 14 | 7 | 7 | 0 | 14 | -0.214 |
| Kings XI Punjab | 14 | 6 | 8 | 0 | 12 | -0.162 |
| Chennai Super Kings | 14 | 6 | 8 | 0 | 12 | -0.455 |
| Rajasthan Royals | 14 | 6 | 8 | 0 | 12 | -0.569 |
IPL Points Table 2019
| Team | Matches Played | Win | Loss | NR | Pts | NRR |
| Mumbai Indians (C) | 14 | 9 | 5 | 0 | 18 | +0.421 |
| Chennai Super Kings (RU) | 14 | 9 | 5 | 0 | 18 | +0.131 |
| Delhi Capitals | 14 | 9 | 5 | 0 | 18 | +0.044 |
| Sunrisers Hyderabad | 14 | 6 | 8 | 0 | 12 | +0.577 |
| Kolkata Knight Riders | 14 | 6 | 8 | 0 | 12 | +0.028 |
| Kings XI Punjab | 14 | 6 | 8 | 0 | 12 | –0.251 |
| Rajasthan Royals | 14 | 5 | 8 | 1 | 11 | –0.449 |
| Royal Challengers Bangalore | 14 | 5 | 8 | 1 | 11 | –0.607 |
IPL Points Table 2018
| Teams | Matches played | Win | Loss | NR | PTS | NRR |
| Sunrisers Hyderabad | 14 | 9 | 5 | 0 | 18 | +0.284 |
| Chennai Super Kings | 14 | 9 | 5 | 0 | 18 | +0.253 |
| Kolkata Knight Riders | 14 | 8 | 6 | 0 | 16 | -0.070 |
| Rajasthan Royals | 14 | 7 | 7 | 0 | 14 | -0.250 |
| Mumbai Indians | 14 | 6 | 8 | 0 | 12 | +0.317 |
| Royal Challengers Bangalore | 14 | 6 | 8 | 0 | 12 | +0.129 |
| Kings XI Punjab | 14 | 6 | 8 | 0 | 12 | -0.502 |
| Delhi Daredevils | 14 | 5 | 9 | 0 | 10 | -0.222 |
IPL Points Table 2017
| Teams | Matches played | Win | Loss | NR | PTS | NRR |
| Mumbai Indians (C) | 14 | 10 | 4 | 0 | 20 | +0.784 |
| Rising Pune Supergiant (RU) | 14 | 9 | 5 | 0 | 18 | +0.176 |
| Sunrisers Hyderabad | 14 | 8 | 5 | 1 | 17 | +0.599 |
| Kolkata Knight Riders | 14 | 8 | 6 | 0 | 16 | +0.641 |
| Kings XI Punjab | 14 | 7 | 7 | 0 | 14 | –0.009 |
| Delhi Daredevils | 14 | 6 | 8 | 0 | 12 | −0.512 |
| Gujarat Lions | 14 | 4 | 10 | 0 | 8 | −0.412 |
| Royal Challengers Bangalore | 14 | 3 | 10 | 1 | 7 | −1.299 |
IPL Points Table 2016
| Teams | Matches played | Win | Loss | NR | PTS | NRR |
| Gujarat Lions | 14 | 9 | 5 | 0 | 18 | -0.374 |
| Royal Challengers Bangalore (RU) | 14 | 8 | 6 | 0 | 16 | +0.932 |
| Sunrisers Hyderabad (C) | 14 | 8 | 6 | 0 | 16 | +0.245 |
| Kolkata Knight Riders | 14 | 8 | 6 | 0 | 16 | +0.106 |
| Mumbai Indians | 14 | 7 | 7 | 0 | 14 | -0.146 |
| Delhi Daredevils | 14 | 7 | 7 | 0 | 14 | -0.155 |
| Rising Pune Supergiants | 14 | 5 | 9 | 0 | 10 | +0.015 |
| Kings XI Punjab | 14 | 4 | 10 | 0 | 8 | -0.646 |
IPL Points Table 2015
| Teams | Matches played | Win | Loss | NR | PTS | NRR |
| Chennai Super Kings (R) | 14 | 9 | 5 | 0 | 18 | +0.709 |
| Mumbai Indians (C) | 14 | 8 | 6 | 0 | 16 | −0.043 |
| Royal Challengers Bangalore | 14 | 7 | 5 | 2 | 16 | +1.037 |
| Rajasthan Royals | 14 | 7 | 5 | 2 | 16 | +0.062 |
| Kolkata Knight Riders | 14 | 7 | 6 | 1 | 15 | +0.253 |
| Sunrisers Hyderabad | 14 | 7 | 7 | 0 | 14 | −0.239 |
| Delhi Daredevils | 14 | 5 | 8 | 1 | 11 | −0.049 |
| Kings XI Punjab | 14 | 3 | 11 | 0 | 6 | −1.436 |
IPL Points Table 2014
| Teams | Matches played | Win | Loss | NR | PTS | NRR |
| Kings XI Punjab (R) | 14 | 11 | 3 | 0 | 22 | +0.968 |
| Kolkata Knight Riders (C) | 14 | 9 | 5 | 0 | 18 | +0.418 |
| Chennai Super Kings | 14 | 9 | 5 | 0 | 18 | +0.385 |
| Mumbai Indians | 14 | 7 | 7 | 0 | 14 | +0.095 |
| Rajasthan Royals | 14 | 7 | 7 | 0 | 14 | +0.060 |
| Sunrisers Hyderabad | 14 | 6 | 8 | 0 | 12 | -0.399 |
| Royal Challengers Bangalore | 14 | 5 | 9 | 0 | 10 | -0.428 |
| Delhi Daredevils | 14 | 2 | 12 | 0 | 4 | -1.182 |
IPL Points Table 2013
| Teams | Matches played | Win | Loss | NR | PTS | NRR |
| Chennai Super Kings (R) | 16 | 11 | 5 | 0 | 22 | +0.530 |
| Mumbai Indians (C) | 16 | 11 | 5 | 0 | 22 | +0.441 |
| Rajasthan Royals | 16 | 10 | 6 | 0 | 20 | +0.322 |
| Sunrisers Hyderabad | 16 | 10 | 6 | 0 | 20 | +0.003 |
| Royal Challengers Bangalore | 16 | 9 | 7 | 0 | 18 | +0.457 |
| Kings XI Punjab | 16 | 8 | 8 | 0 | 16 | +0.226 |
| Kolkata Knight Riders | 16 | 6 | 10 | 0 | 12 | −0.065 |
| Pune Warriors India | 16 | 4 | 12 | 0 | 8 | −1.006 |
| Delhi Daredevils | 16 | 3 | 13 | 0 | 6 | −0.848 |
IPL Points Table 2012
| Teams | Matches played | Win | Loss | NR | PTS | NRR |
| Delhi Daredevils | 16 | 11 | 5 | 0 | 22 | +0.617 |
| Kolkata Knight Riders (C) | 16 | 10 | 5 | 1 | 21 | +0.561 |
| Mumbai Indians | 16 | 10 | 6 | 0 | 20 | −0.100 |
| Chennai Super Kings (R) | 16 | 8 | 7 | 1 | 17 | +0.100 |
| Royal Challengers Bangalore | 16 | 8 | 7 | 1 | 17 | −0.022 |
| Kings XI Punjab | 16 | 8 | 8 | 0 | 16 | −0.216 |
| Rajasthan Royals | 16 | 7 | 9 | 0 | 14 | +0.201 |
| Deccan Chargers | 16 | 4 | 11 | 1 | 9 | −0.509 |
| Pune Warriors India | 16 | 4 | 12 | 0 | 8 | −0.551 |
IPL Points Table 2011
| Teams | Matches played | Win | Loss | NR | PTS | NRR |
| Royal Challengers Bangalore (R) | B | 9 | 4 | 1 | 19 | +0.326 |
| Chennai Super Kings (C) | B | 9 | 5 | 0 | 18 | +0.443 |
| Mumbai Indians | A | 9 | 5 | 0 | 18 | +0.040 |
| Kolkata Knight Riders | B | 8 | 6 | 0 | 16 | +0.433 |
| Kings XI Punjab | A | 7 | 7 | 0 | 14 | −0.051 |
| Rajasthan Royals | B | 6 | 7 | 1 | 13 | −0.691 |
| Deccan Chargers | A | 6 | 8 | 0 | 12 | +0.222 |
| Kochi Tuskers Kerala | B | 6 | 8 | 0 | 12 | −0.214 |
| Pune Warriors India | A | 4 | 9 | 1 | 9 | −0.134 |
| Delhi Daredevils | A | 4 | 9 | 1 | 9 | −0.448 |
IPL Points Table 2010
| Teams | Matches played | Win | Loss | NR | PTS | NRR |
| Mumbai Indians (R) | 14 | 10 | 4 | 0 | 20 | +1.084 |
| Deccan Chargers | 14 | 8 | 6 | 0 | 16 | −0.297 |
| Chennai Super Kings (C) | 14 | 7 | 7 | 0 | 14 | +0.274 |
| Royal Challengers Bangalore | 14 | 7 | 7 | 0 | 14 | +0.219 |
| Delhi Daredevils | 14 | 7 | 7 | 0 | 14 | +0.021 |
| Kolkata Knight Riders | 14 | 7 | 7 | 0 | 14 | −0.341 |
| Rajasthan Royals | 14 | 6 | 8 | 0 | 12 | −0.514 |
| Kings XI Punjab | 14 | 4 | 10 | 0 | 8 | −0.478 |
IPL Points Table 2009
| Teams | Matches played | Win | Loss | NR | PTS | NRR |
| Delhi Daredevils | 14 | 10 | 4 | 0 | 20 | +0.311 |
| Chennai Super Kings | 14 | 8 | 5 | 1 | 17 | +0.951 |
| Royal Challengers Bangalore (R) | 14 | 8 | 6 | 0 | 16 | −0.191 |
| Deccan Chargers (C) | 14 | 7 | 7 | 0 | 14 | +0.203 |
| Kings XI Punjab | 14 | 7 | 7 | 0 | 14 | -0.483 |
| Rajasthan Royals | 14 | 6 | 7 | 1 | 13 | −0.352 |
| Mumbai Indians | 14 | 5 | 8 | 1 | 11 | +0.297 |
| Kolkata Knight Riders | 14 | 3 | 10 | 1 | 7 | −0.789 |
IPL Points Table 2008
| Teams | Matches played | Win | Loss | NR | PTS | NRR |
| Rajasthan Royals (C) | 14 | 11 | 3 | 0 | 22 | +0.632 |
| Kings XI Punjab | 14 | 10 | 4 | 0 | 20 | +0.509 |
| Chennai Super Kings (R) | 14 | 8 | 6 | 0 | 16 | −0.192 |
| Delhi Daredevils | 14 | 7 | 6 | 1 | 15 | +0.342 |
| Mumbai Indians | 14 | 7 | 7 | 0 | 14 | +0.570 |
| Kolkata Knight Riders | 14 | 6 | 7 | 1 | 13 | −0.147 |
| Royal Challengers Bangalore | 14 | 4 | 10 | 0 | 8 | −1.161 |
| Deccan Chargers | 14 | 2 | 12 | 0 | 4 | −0.467 |
IPL Winners, Runners List
| Season | Stadium (Final Match) | City/Country | Winner Team | Runner up |
| 2008 | DY Patil Stadium | Mumbai | Rajasthan Royals | Chennai Super Kings |
| 2009 | Wanderers Stadium | South Africa | Deccan Chargers | Royal Challengers Bangalore |
| 2010 | DY Patil Stadium | Mumbai | Chennai Super Kings | Mumbai Indians |
| 2011 | M. A. Chidambaram Stadium | Chennai | Chennai Super Kings | Royal Challengers Bangalore |
| 2012 | M. A. Chidambaram Stadium | Chennai | Kolkata Knight Riders | Chennai Super Kings |
| 2013 | Eden Gardens | Kolkata | Mumbai Indians | Chennai Super Kings |
| 2014 | M. Chinnaswamy Stadium | Bangalore | Kolkata Knight Riders | Kings XI Punjab |
| 2015 | Eden Gardens | Kolkata | Mumbai Indians | Chennai Super Kings |
| 2016 | M. Chinnaswamy Stadium | Bangalore | Sunrisers Hyderabad | Royal Challengers Bangalore |
| 2017 | Rajiv Gandhi Stadium | Hyderabad | Mumbai Indians | Rising Pune Supergiant |
| 2018 | Wankhede Stadium | Mumbai | Chennai Super Kings | Sunrisers Hyderabad |
| 2019 | Rajiv Gandhi Stadium | Hyderabad | Mumbai Indians | Chennai Super Kings |
| 2020 | Dubai International Cricket Stadium | Dubai | Mumbai Indians | Delhi Capitals |
| 2021 | Dubai International Cricket Stadium | Dubai | Chennai Super Kings | Kolkata Knight Riders |
| 2022 | Narendra Modi Stadium | Ahmedabad | Gujarat Titans | Rajasthan Royals |
| 2023 | Narendra Modi Stadium | Ahmedabad | Chennai Super Kings | Gujarat Titans |
Also read: IPL Winners List Since 2008 Along With Player of Match And Player Of Series Details

